Reddit QQQ Data Tables
Core Conclusions
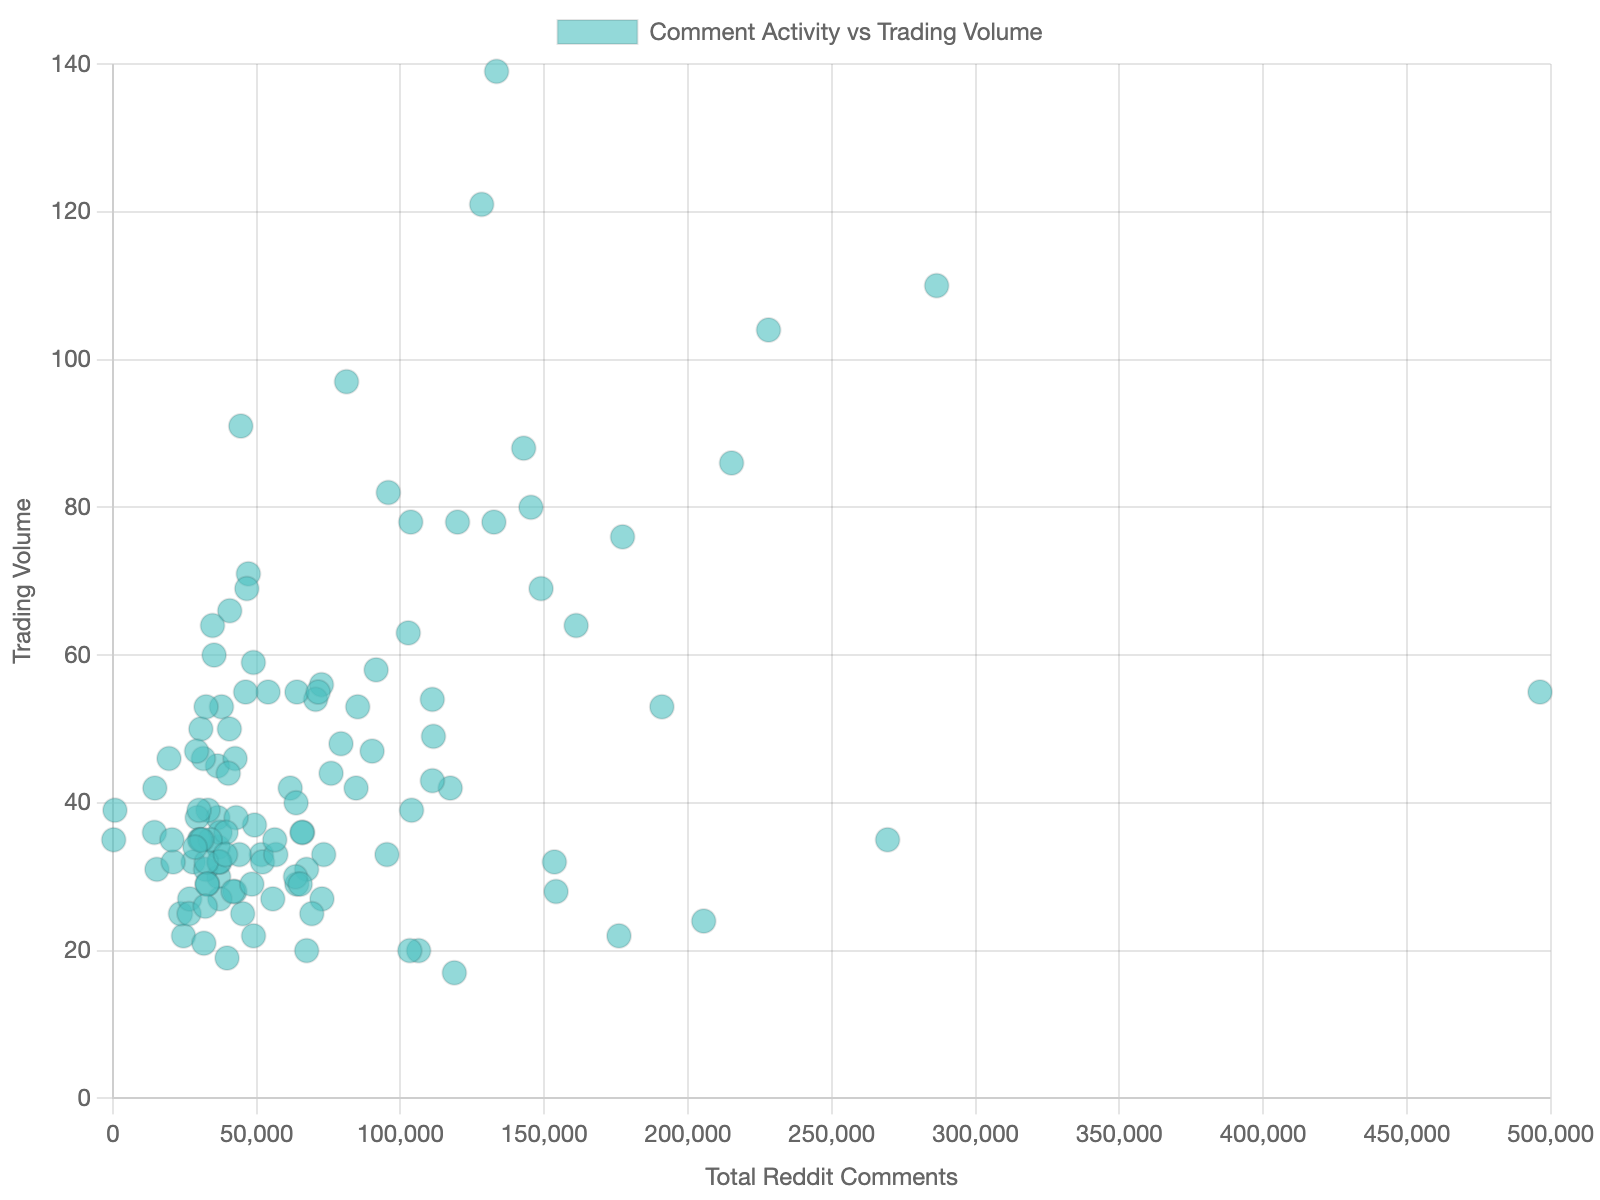
- Sentiment-Volume Relationship: There appears to be a positive correlation between Reddit discussion activity and QQQ trading volume, suggesting that increased social media attention may lead to higher market participation.
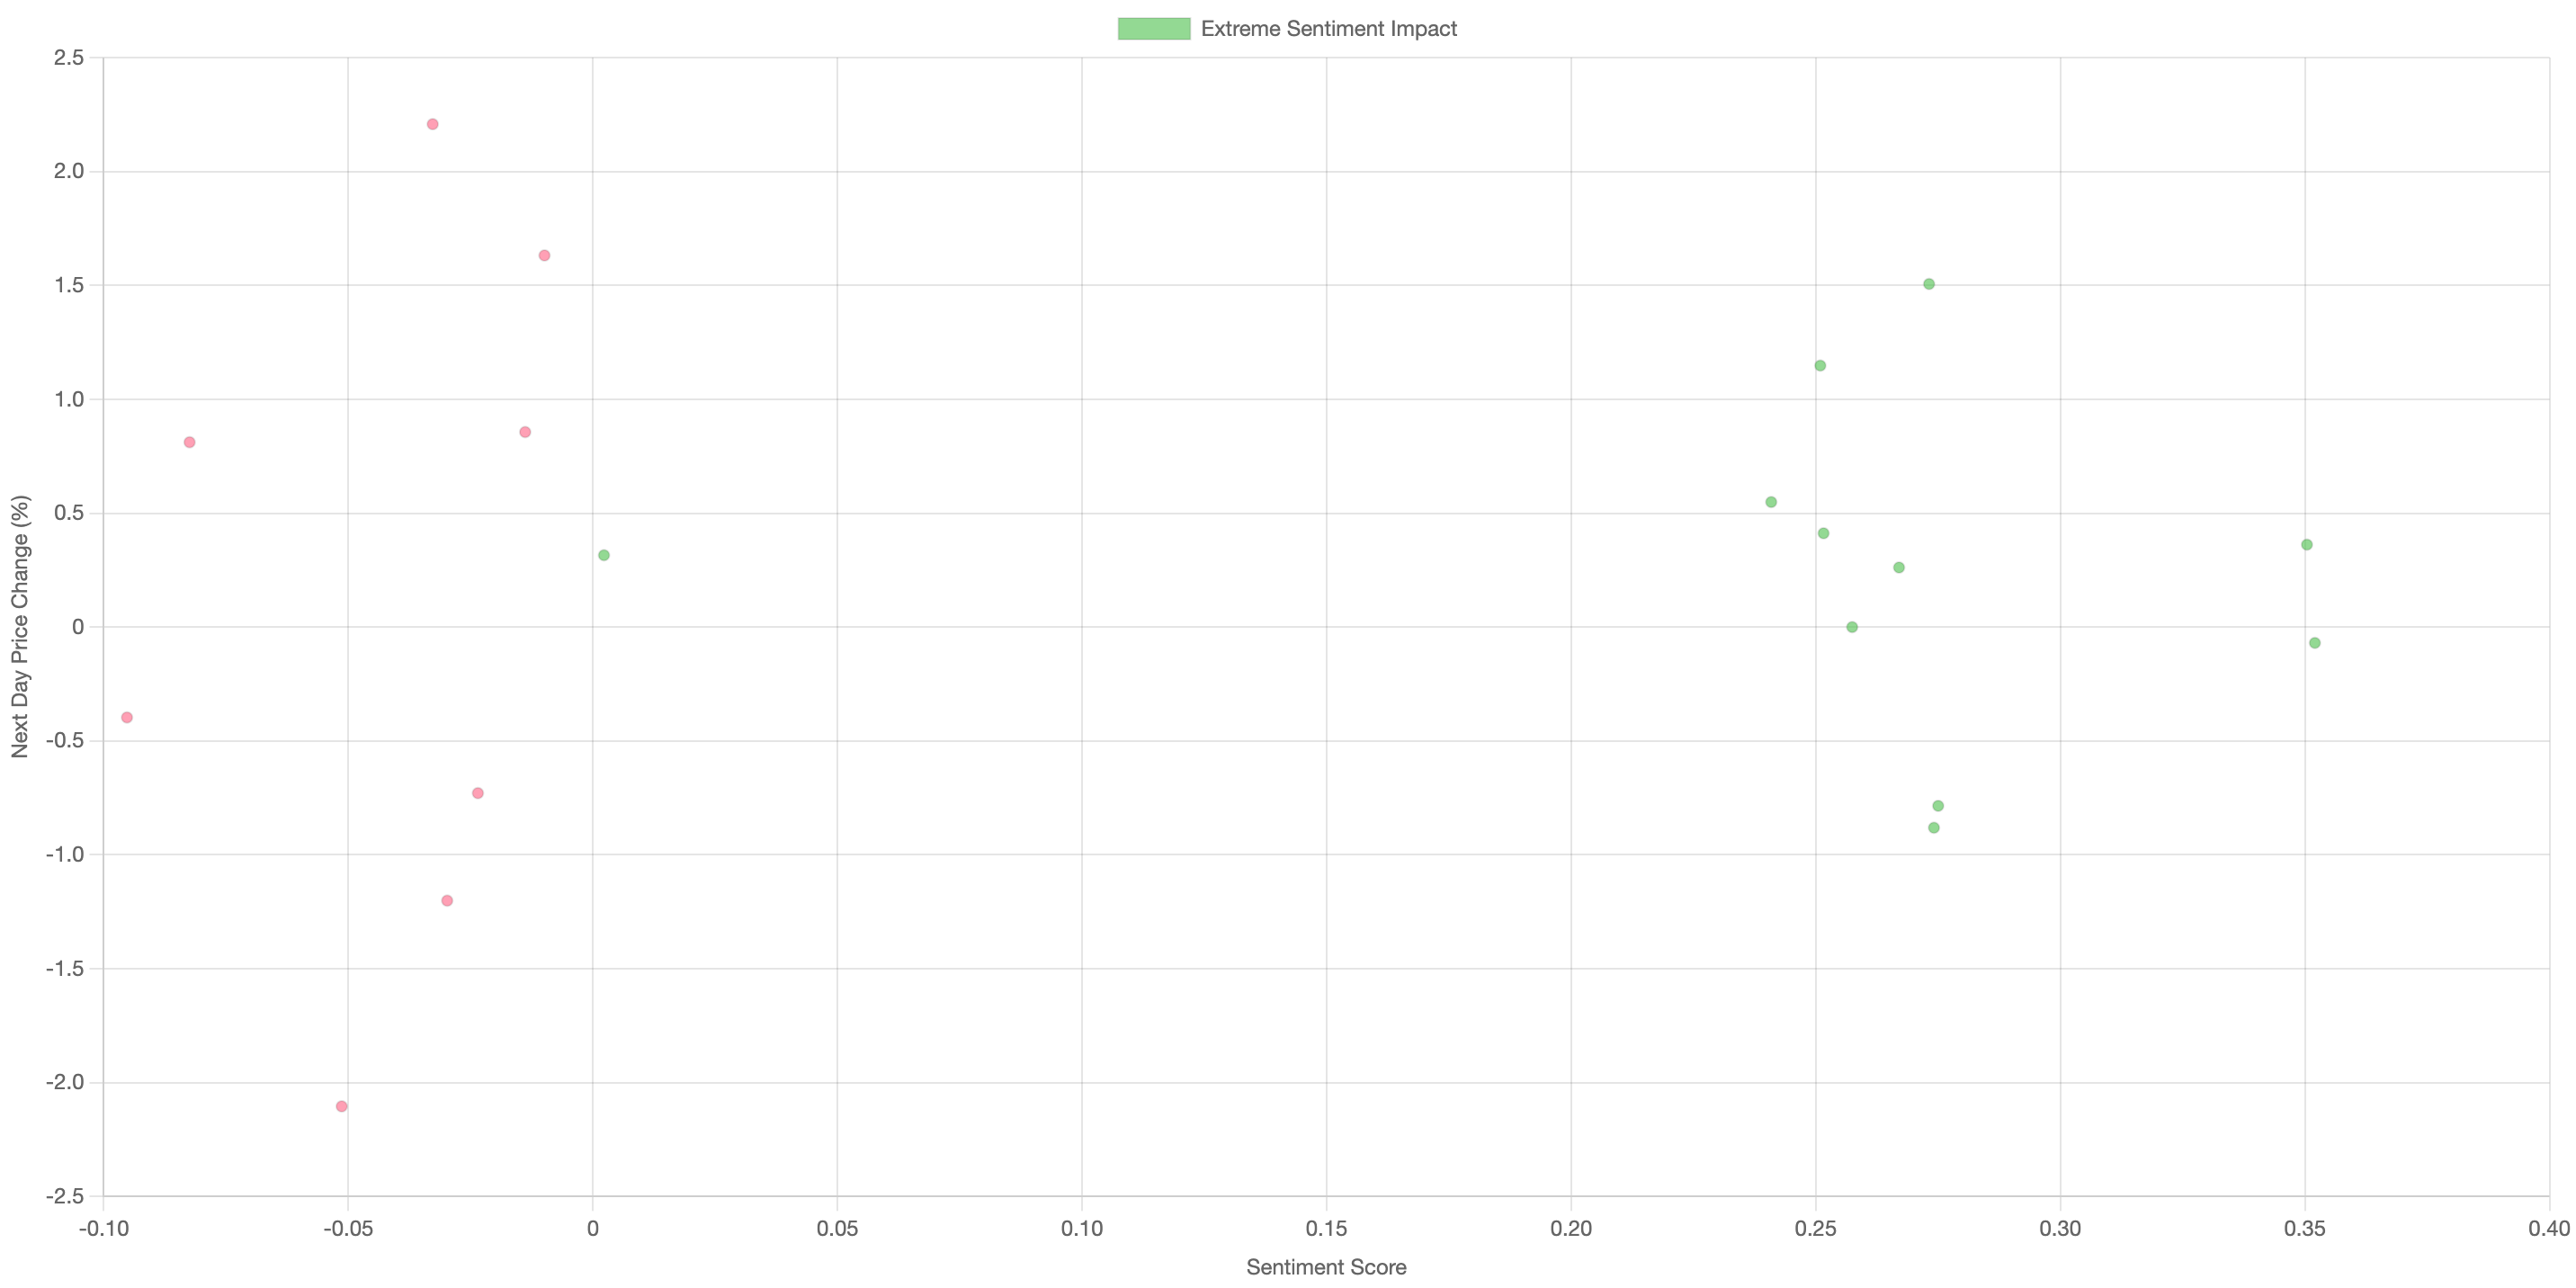
- Extreme Sentiment Impact: Days with extreme sentiment (both positive and negative) tend to be followed by larger price movements, indicating that strong sentiment may have predictive value for market movements.
- Post Popularity: Highly upvoted posts show a stronger correlation with next-day price changes than less popular posts, suggesting that post visibility may influence market behavior.
- Sentiment Components: The balance between positive, neutral, and negative sentiment appears to shift before significant price movements, potentially serving as an early indicator of market sentiment changes.
- Immediate vs Delayed Impact: While sentiment shows some immediate impact on same-day price movements, the strongest correlations appear with next-day price changes, suggesting a delayed market reaction to social media sentiment.
1. Sentiment Analysis
| Date | Total Posts | Positive | Negative | Neutral | Avg Sentiment | Total Comments | Avg Score |
|---|---|---|---|---|---|---|---|
| 16/08/2021 | 10 | 9 | 1 | 0 | 0.274 | 300 | 72.7 |
| 15/08/2021 | 10 | 9 | 1 | 0 | 0.242 | 12,626 | 2,428.6 |
| 14/08/2021 | 10 | 1 | 4 | 5 | -0.092 | 4,069 | 3,610.1 |
| 13/08/2021 | 10 | 5 | 2 | 3 | 0.125 | 39,724 | 3,386.7 |
| 12/08/2021 | 10 | 7 | 1 | 2 | 0.195 | 32,144 | 2,617.1 |
| 11/08/2021 | 10 | 5 | 1 | 4 | 0.169 | 28,550 | 4,267.2 |
| 10/08/2021 | 10 | 6 | 2 | 2 | 0.192 | 30,965 | 1,304.0 |
| 09/08/2021 | 10 | 5 | 0 | 5 | 0.153 | 26,518 | 5,908.7 |
| 08/08/2021 | 10 | 5 | 0 | 5 | 0.135 | 12,182 | 5,939.7 |
| 07/08/2021 | 10 | 0 | 3 | 7 | -0.058 | 3,874 | 6,826.5 |
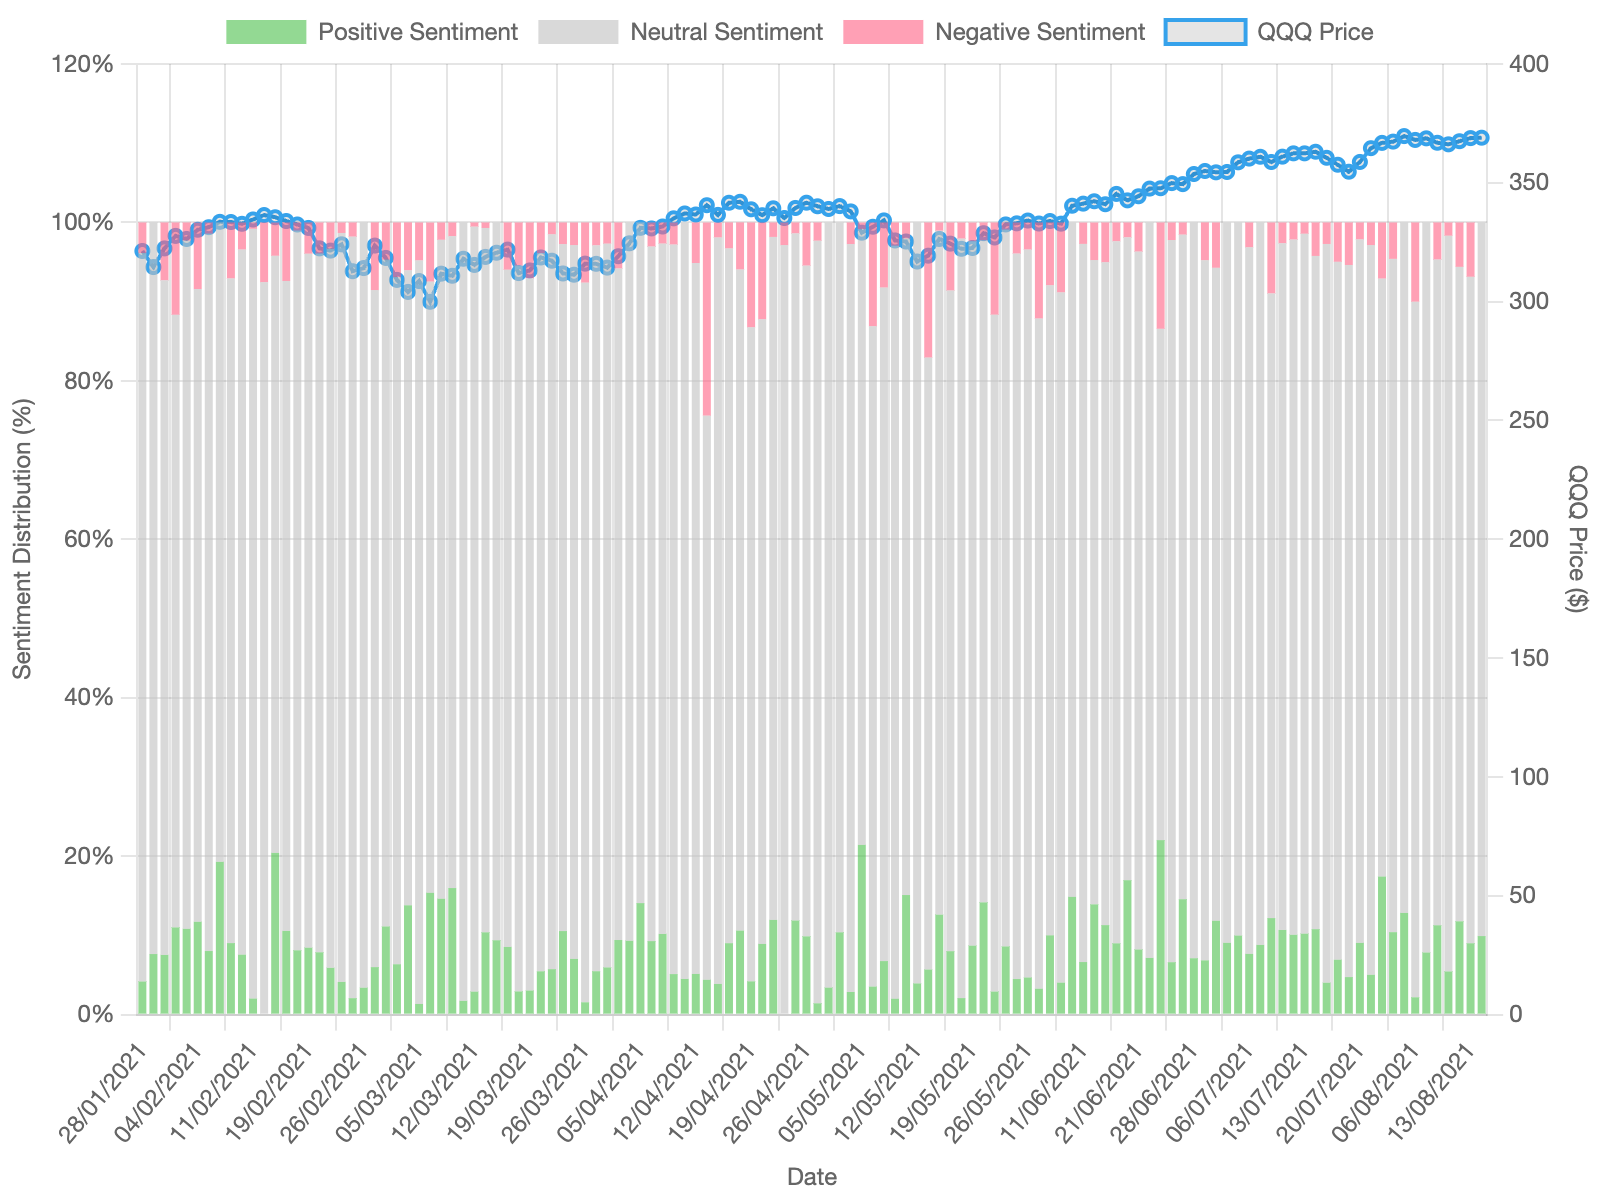
Sentiment Components Analysis
This stacked bar chart shows the daily distribution of sentiment components (positive, neutral, and negative) with the QQQ price overlaid as a line. We're examining how the balance of different sentiment types relates to price movements and whether certain sentiment patterns tend to precede price changes.
Extreme Sentiment Days Analysis
This visualization focuses on days with the highest and lowest sentiment values, comparing them to next-day price changes. The point size represents the number of posts that day. We're investigating whether extreme sentiment days (both positive and negative) tend to predict significant price movements, and if the volume of posts affects this relationship.
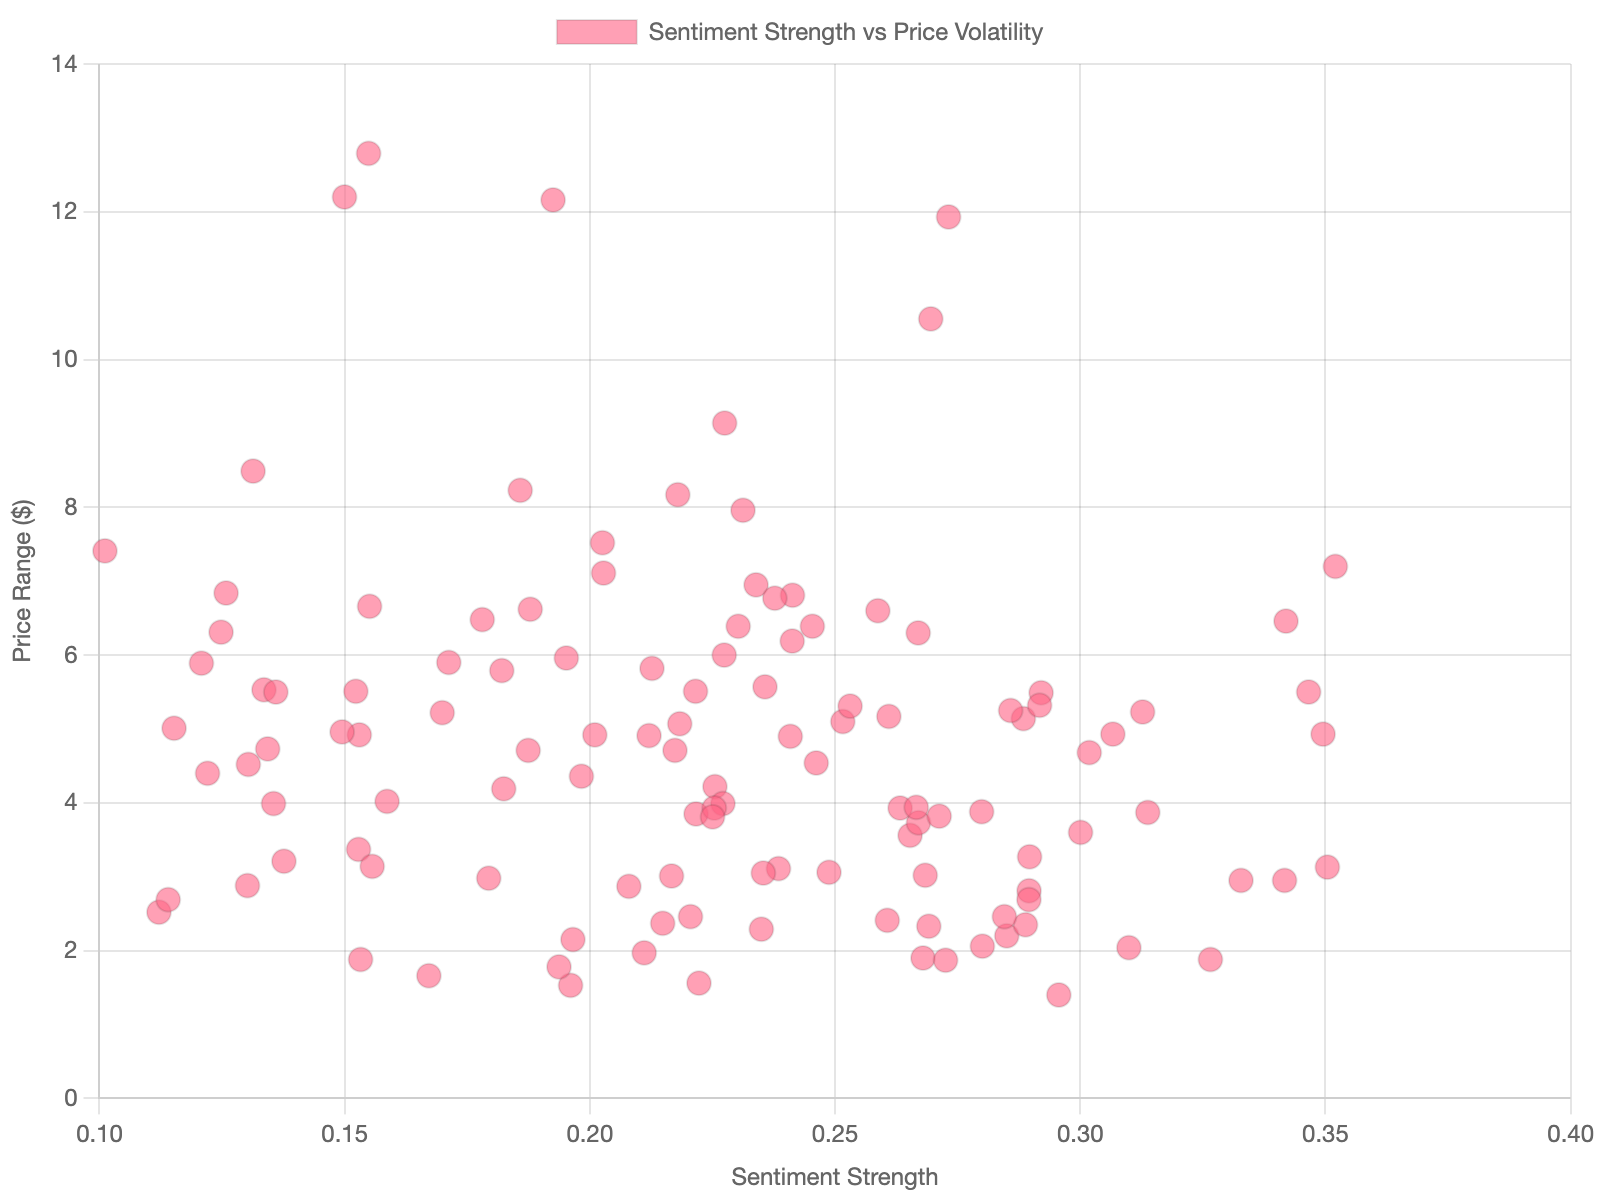
Sentiment Strength vs Price Volatility
This visualization examines whether stronger sentiment (measured by the number of positive posts) correlates with more volatile price movements. The daily price range (High - Low) is used as a measure of volatility. We're investigating if stronger sentiment leads to more dramatic price swings during the trading day.
2. Price Impact Analysis
| Date | Avg Sentiment | Posts | Open | Close | Price Change % | Volume |
|---|---|---|---|---|---|---|
| 16/08/2021 | 0.274 | 10 | $367.67 | $368.98 | 0.36% | 35,044,107 |
| 15/08/2021 | 0.242 | 10 | $0.00 | $0.00 | 0.00% | 0 |
| 14/08/2021 | -0.092 | 10 | $0.00 | $0.00 | 0.00% | 0 |
| 13/08/2021 | 0.125 | 10 | $367.89 | $368.82 | 0.25% | 19,336,190 |
| 12/08/2021 | 0.195 | 10 | $365.69 | $367.53 | 0.50% | 26,003,877 |
| 11/08/2021 | 0.169 | 10 | $368.14 | $366.21 | -0.52% | 34,249,812 |
| 10/08/2021 | 0.192 | 10 | $369.26 | $366.84 | -0.66% | 35,130,796 |
| 09/08/2021 | 0.153 | 10 | $368.52 | $368.73 | 0.06% | 25,960,245 |
| 08/08/2021 | 0.135 | 10 | $0.00 | $0.00 | 0.00% | 0 |
| 07/08/2021 | -0.058 | 10 | $0.00 | $0.00 | 0.00% | 0 |
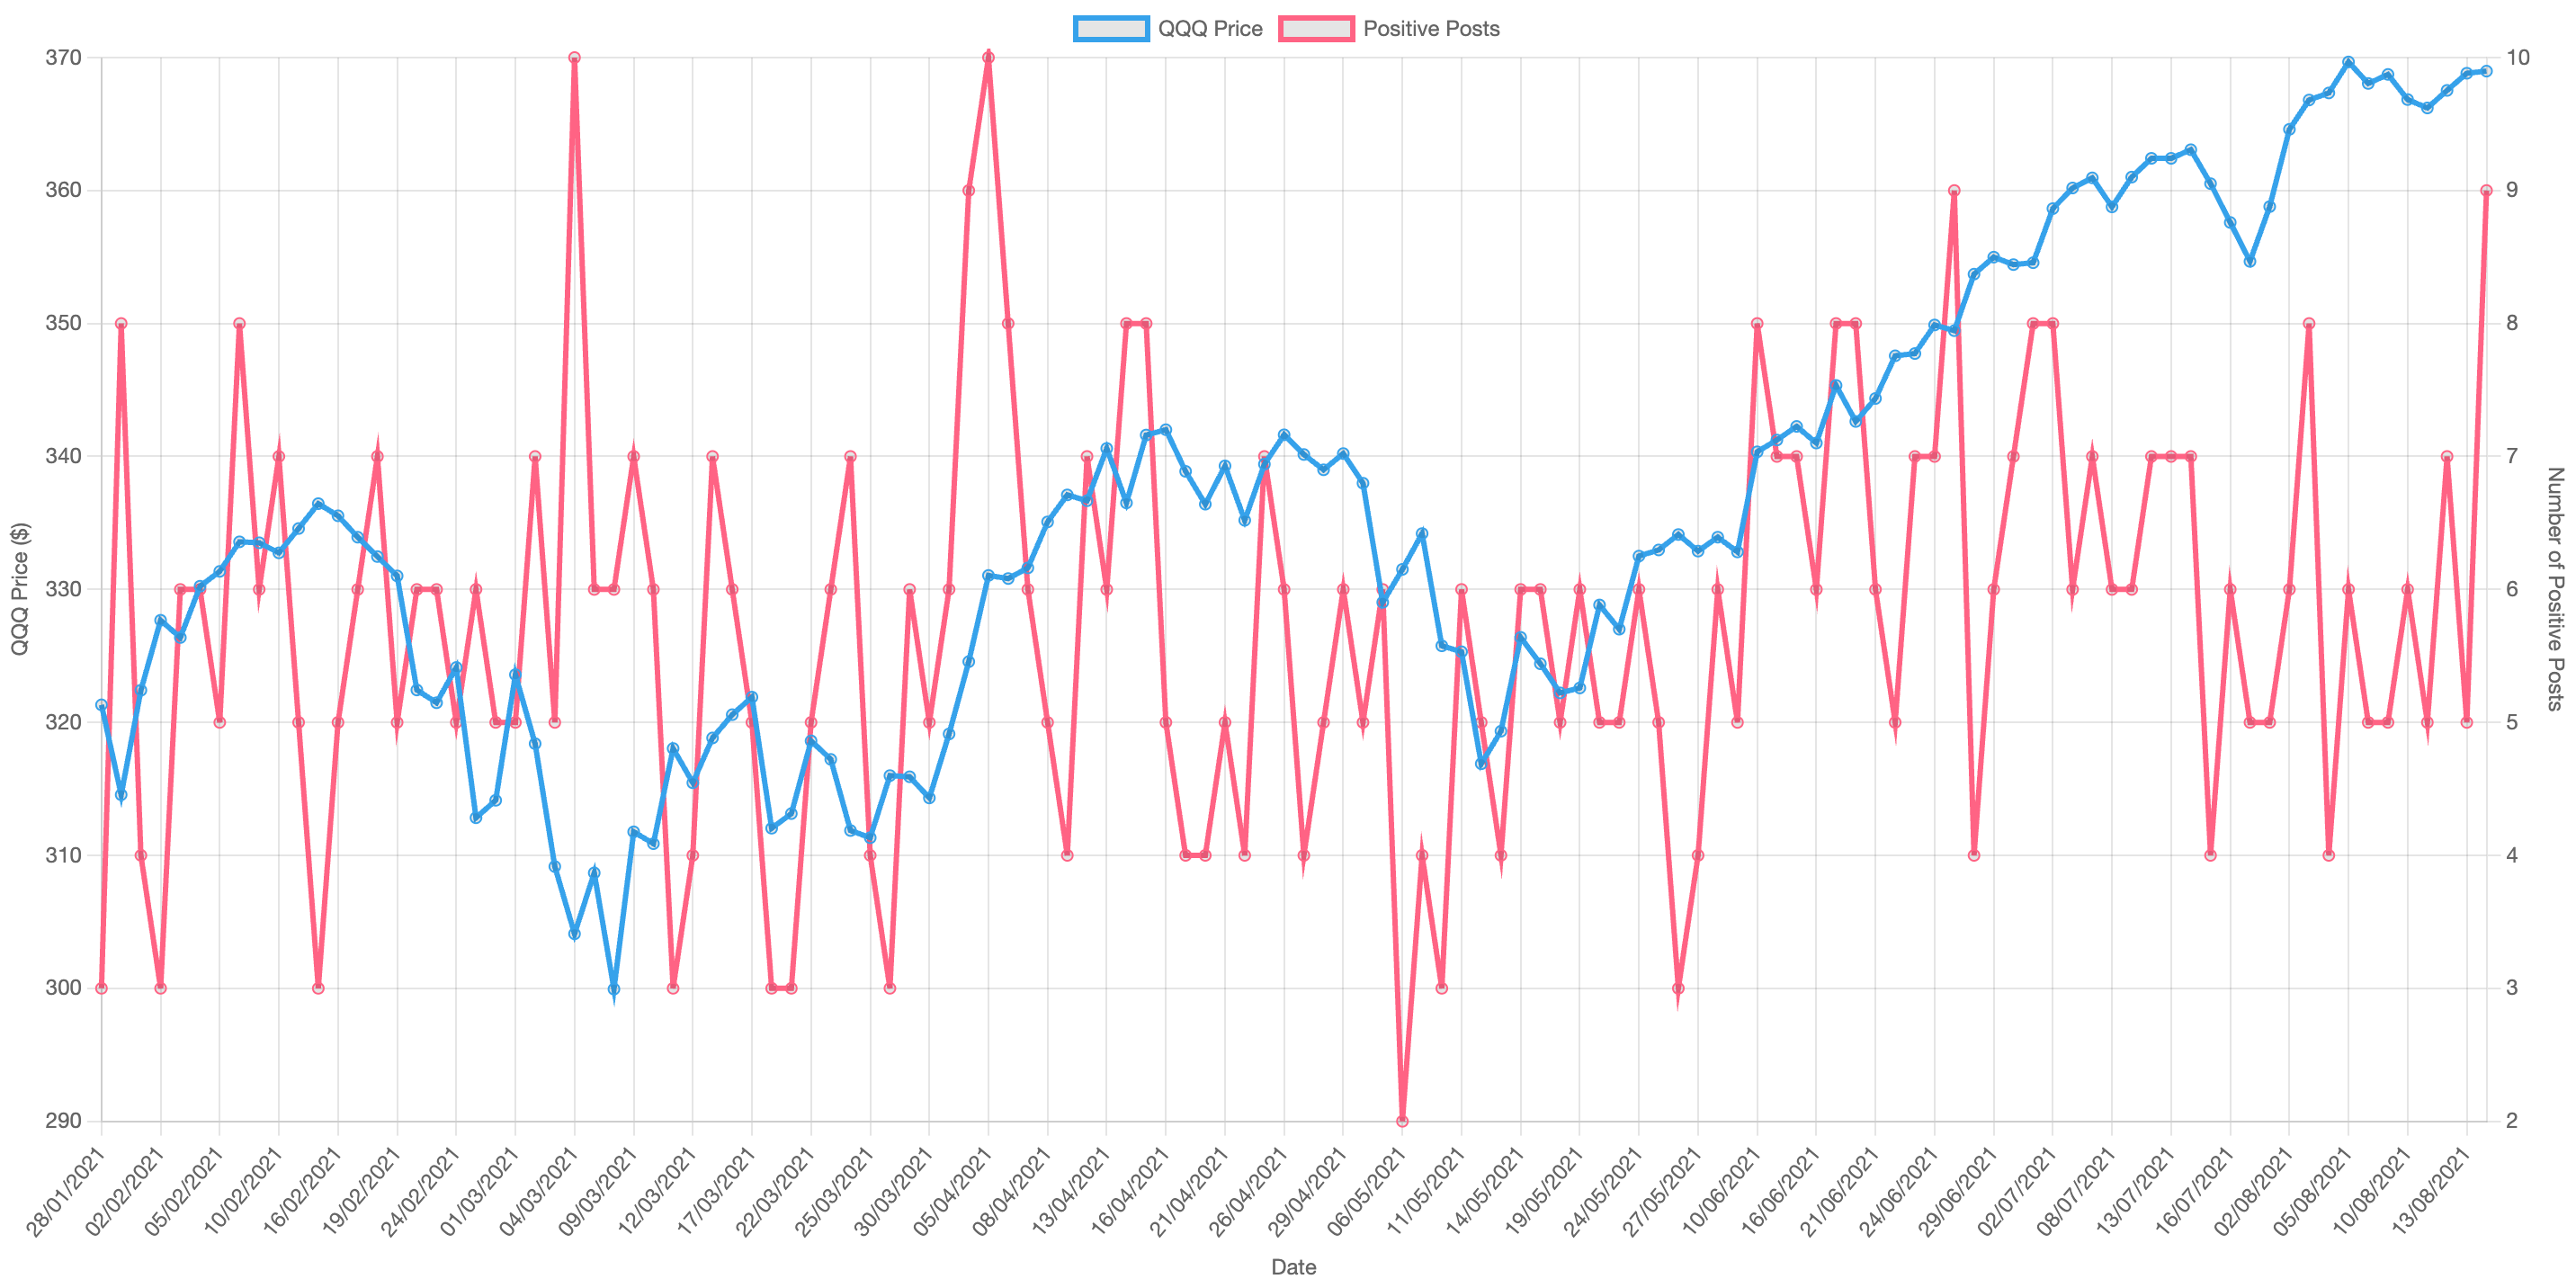
Price vs Sentiment Correlation
This dual-axis chart shows the relationship between QQQ price and sentiment.
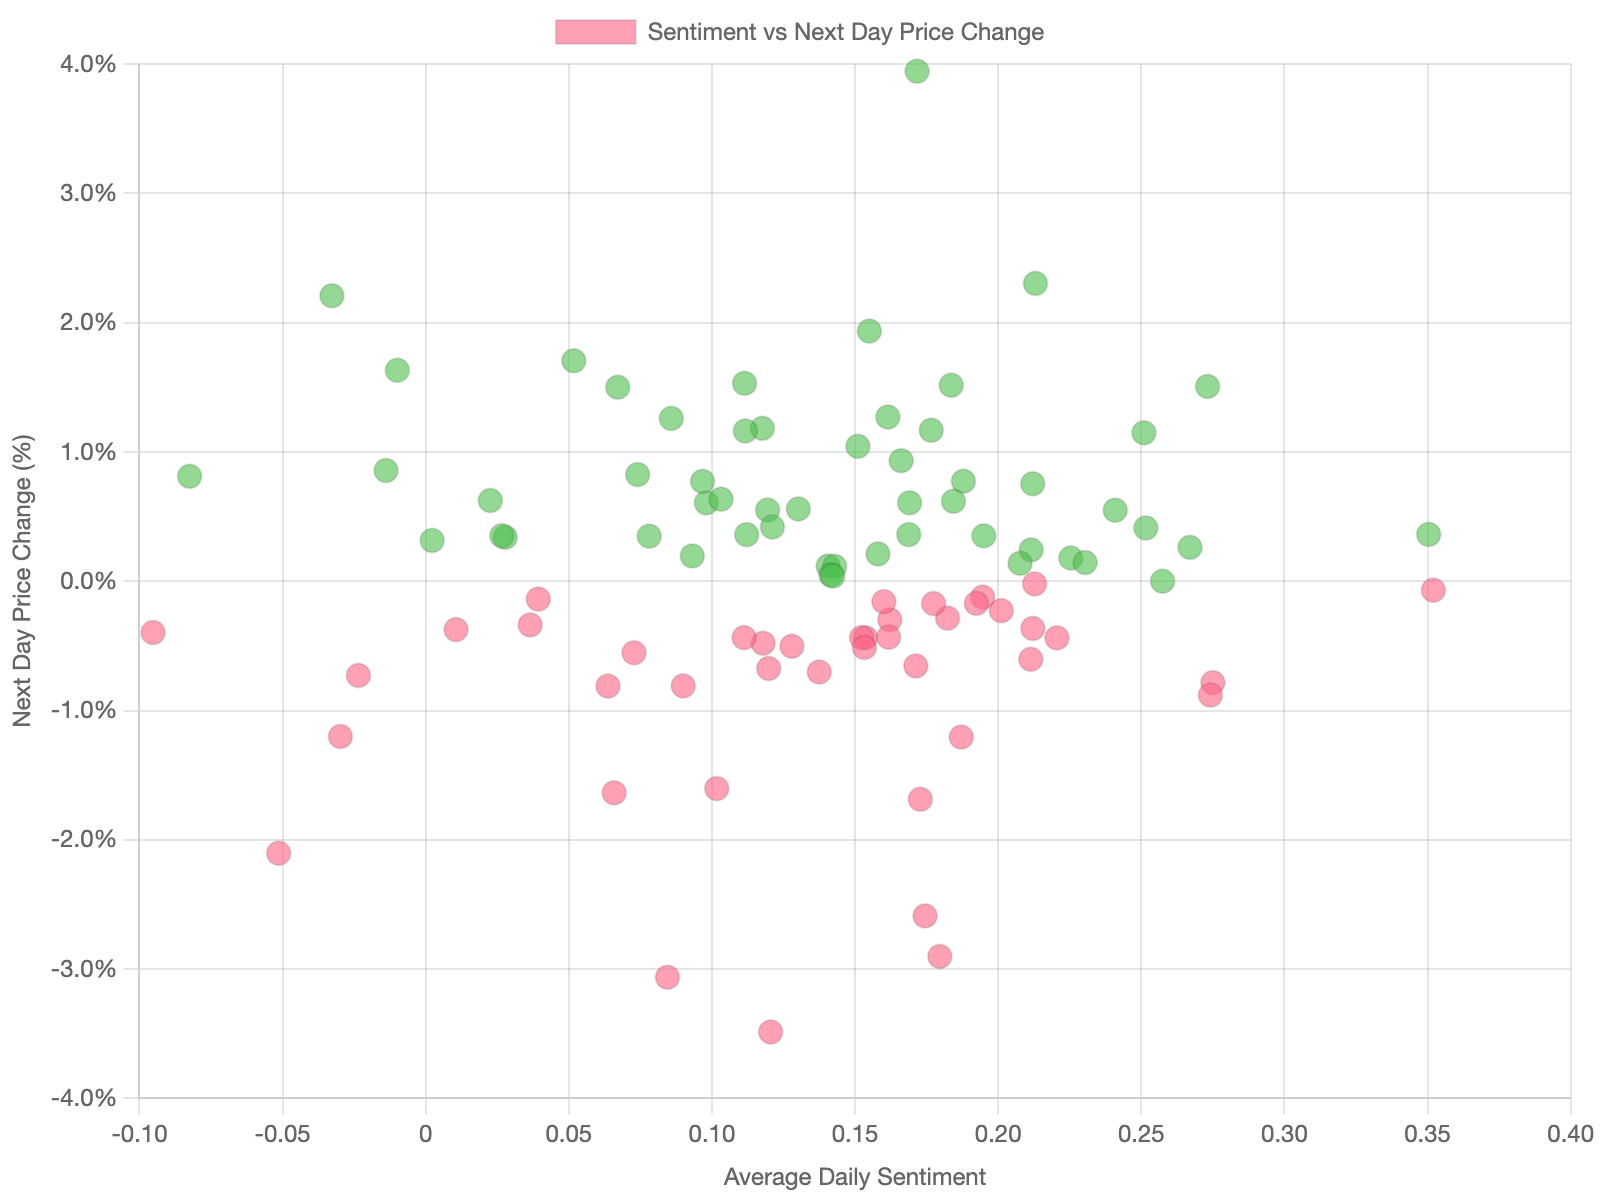
Sentiment Momentum Analysis
This scatter plot shows the relationship between daily average sentiment and next-day price changes.
Sentiment Lag Analysis
This heatmap shows how sentiment impacts price over multiple days.
3. Trading Activity Analysis
| Date | Posts | Comments | Avg Score | Trading Volume | Price Range | Price Change % |
|---|---|---|---|---|---|---|
| 16/08/2021 | 10 | 300 | 72.7 | 35,044,107 | $5.32 | 0.36% |
| 15/08/2021 | 10 | 12,626 | 2,428.6 | 0 | $0.00 | 0.00% |
| 14/08/2021 | 10 | 4,069 | 3,610.1 | 0 | $0.00 | 0.00% |
| 13/08/2021 | 10 | 39,724 | 3,386.7 | 19,336,190 | $1.78 | 0.25% |
| 12/08/2021 | 10 | 32,144 | 2,617.1 | 26,003,877 | $3.60 | 0.50% |
| 11/08/2021 | 10 | 28,550 | 4,267.2 | 34,249,812 | $3.81 | -0.52% |
| 10/08/2021 | 10 | 30,965 | 1,304.0 | 35,130,796 | $3.94 | -0.66% |
| 09/08/2021 | 10 | 26,518 | 5,908.7 | 25,960,245 | $1.88 | 0.06% |
| 08/08/2021 | 10 | 12,182 | 5,939.7 | 0 | $0.00 | 0.00% |
| 07/08/2021 | 10 | 3,874 | 6,826.5 | 0 | $0.00 | 0.00% |
Trading Volume vs Reddit Comments
This visualization focuses on days with the highest and lowest sentiment values, comparing them to next-day price changes. The point size represents the number of posts that day. We're investigating whether extreme sentiment days (both positive and negative) tend to predict significant price movements, and if the volume of posts affects this relationship.
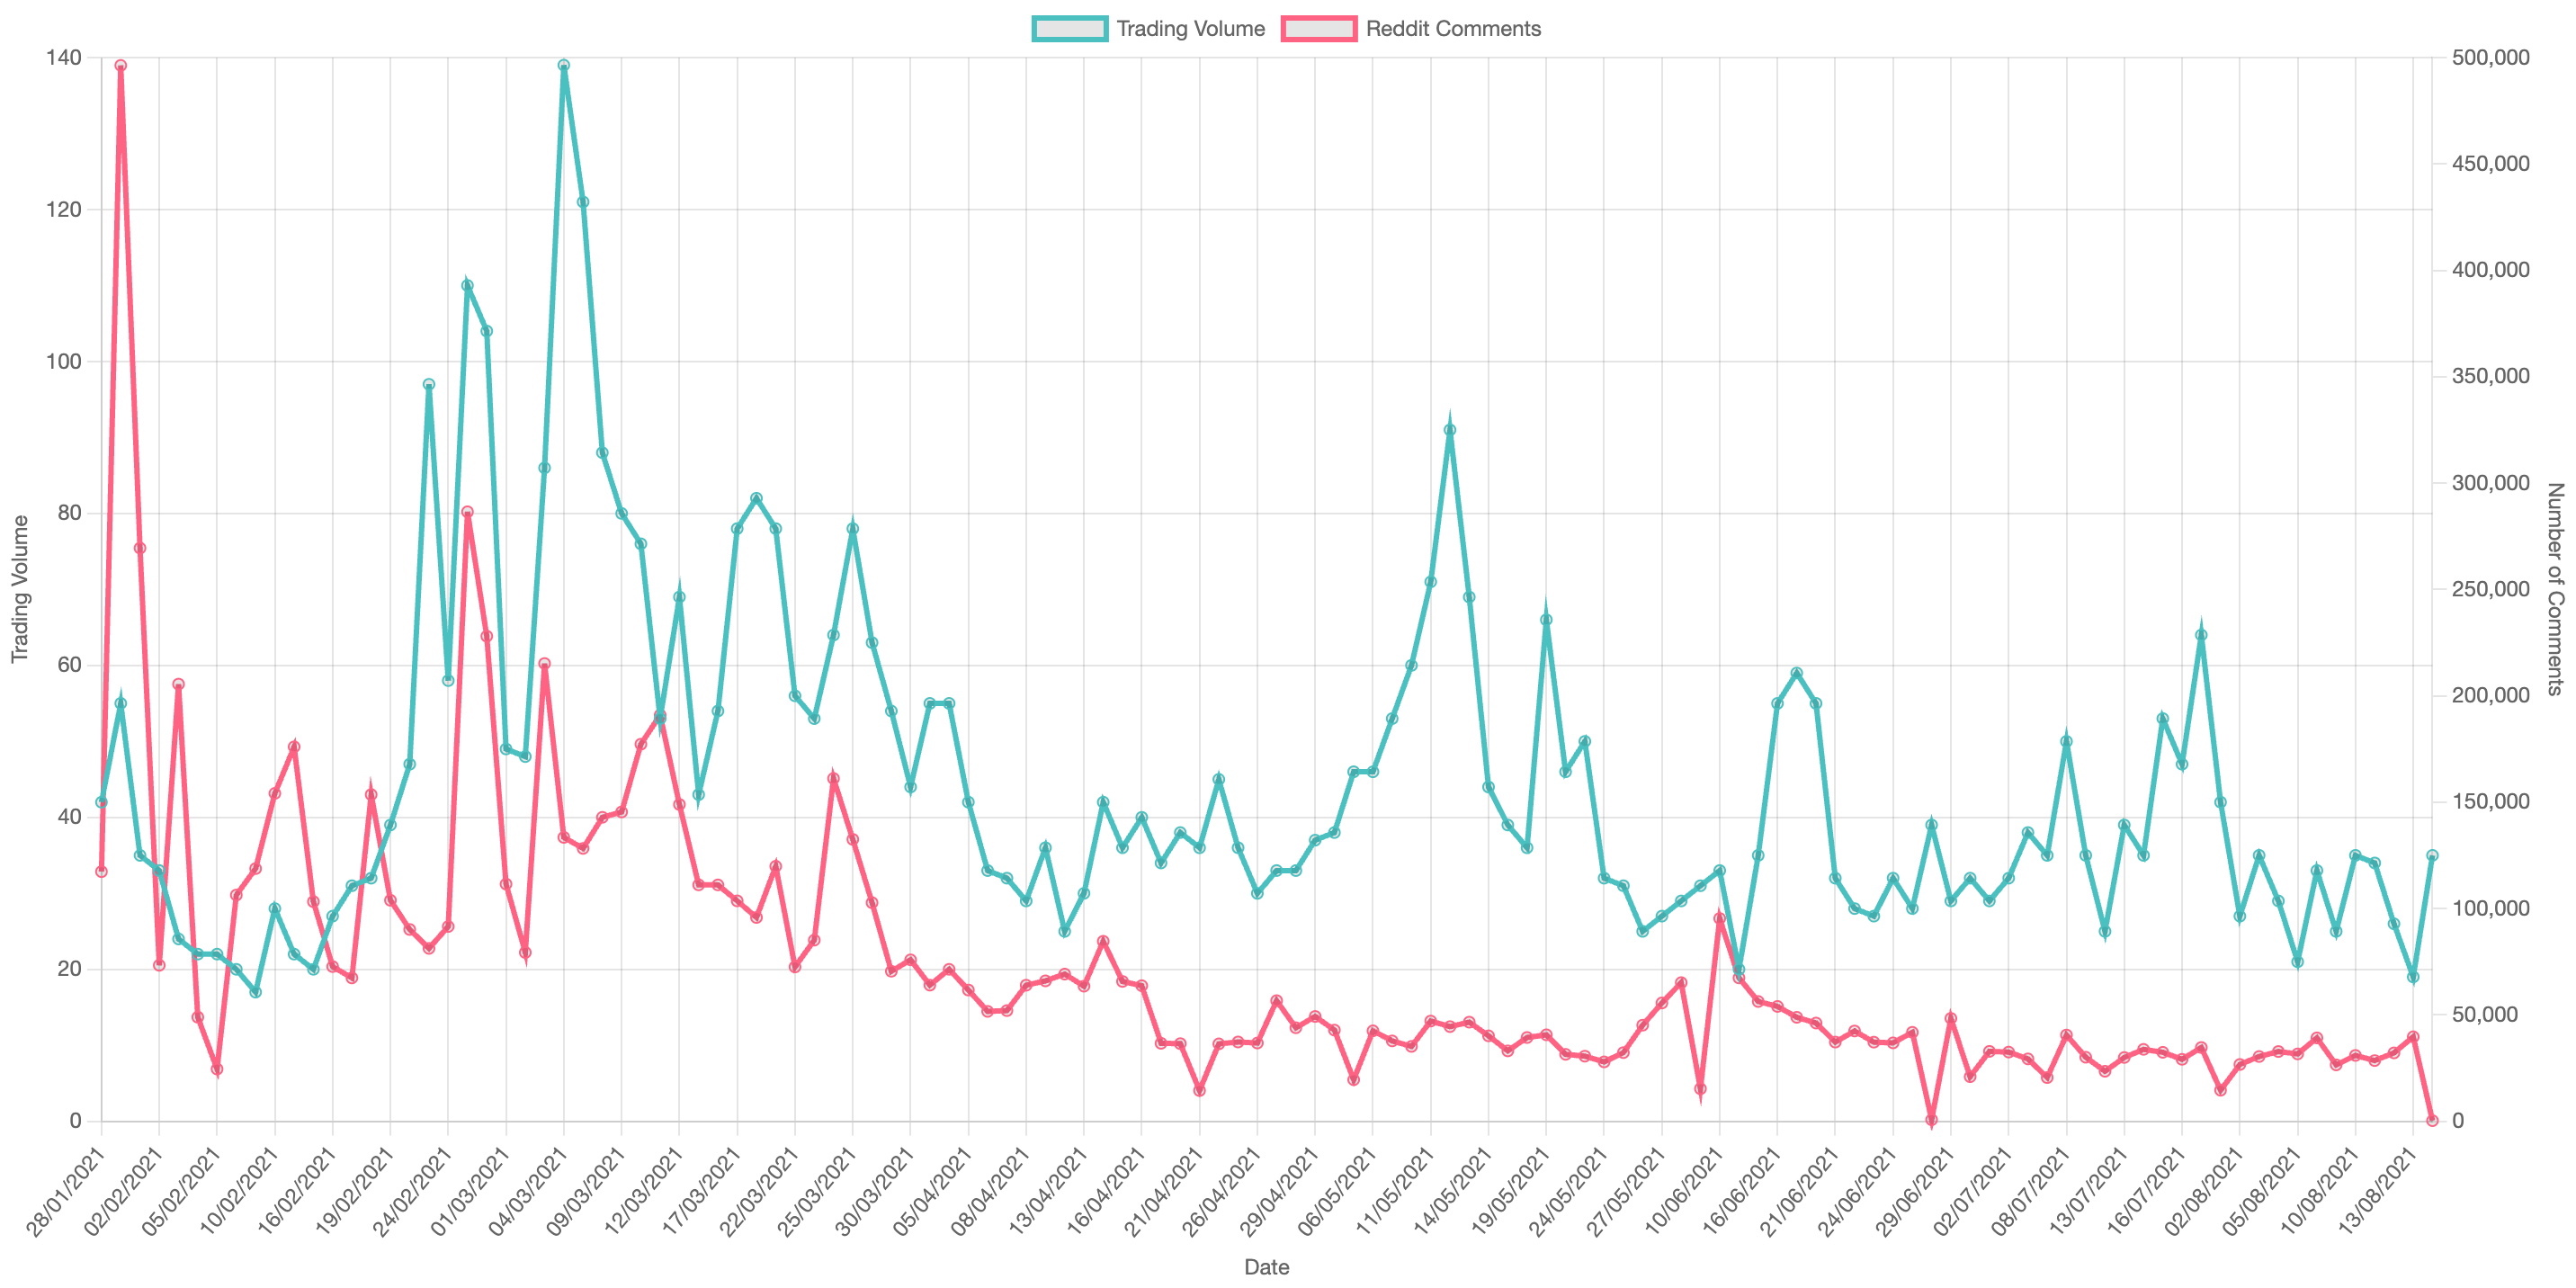
Volume vs Reddit Activity
This dual-axis chart compares trading volume with Reddit activity.
Price Volatility vs Sentiment
This scatter plot shows the relationship between price volatility and sentiment.
