Museum Data Across the US

Museum Name Type Musuem ID City State Phone Number Income Revenue
BIRMINGHAM CIVIL RIGHTS INSTITUTE HISTORY MUSEUM & PRESERVATION 8400100229 BIRMINGHAM AL 2053289696 2736160 2736160
ACADEMY INTERACTIVE ARTS SCIENCES ART MUSEUM 8400602841 CALABASAS CA 8188760826 2277028 1826158
FALLBROOK GEM AND MINERAL MUSEUM GENERAL MUSEUM 8400600492 FALLBROOK CA 7607281130 104325 76609
GETTY MUSEUM GENERAL MUSEUM 8400602588 LOS ANGELES CA 3104407300 2501338195 370248983
CALIFORNIA ACADEMY OF SCIENCE HISTORY MUSEUM & PRESERVATION 8400602201 SAN FRANCISCO CA 4153798000 91703732 91703732
CENTER FOR CONTEMPORARY PRINTMAKING GENERAL MUSEUM 8400900081 NORWALK CT 2038997999 791156 675644
WINDHAM TEXTILE AND HISTORY MUSEUM HISTORY MUSEUM & PRESERVATION 8400900197 WILLIMANTIC CT 8604562178 84007 79696
SMITHSONIAN INSTITUTION NATURAL HISTORY MUSEUM HISTORY MUSEUM & PRESERVATION 8401100024 WASHINGTON DC 2026331000 2064935223 1371587031
HEUSER ART CENTER GALLERY ART MUSEUM 8409503404 PEORIA IL 3096772989 234090029 233822797
BLUEGRASS CONSERVANCY ARBORETUM, BOTANICAL GARDEN, OR NATURE CENTER 8402100383 LEXINGTON KY 8592554552 600265 514061
NATIONAL AQUARIUM CONSERVATION CENTER SCIENCE & TECHNOLOGY MUSEUM OR PLANETARIUM 8402400252 BALTIMORE MD 4105763800 411298 411298
INSTITUTE FOR LEARNING INNOVATION SCIENCE & TECHNOLOGY MUSEUM OR PLANETARIUM 8402400417 EDGEWATER MD 4109565144 910704 865455
BELFAST MUSEUM HISTORY MUSEUM & PRESERVATION 8402300532 BELFAST ME 2073389229 163740 150554
WEST MICH CENTER FOR ARTS & TECHNOLOGY GENERAL MUSEUM 8402601068 GRAND RAPIDS MI 6164547004 1674814 1622797
R E OLDS TRANSPORTATION MUSEUM HISTORY MUSEUM & PRESERVATION 8402600531 LANSING MI 5173720422 192594 152112
YELLOWSTONE ART MUSEUM ART MUSEUM 8403000292 BILLINGS MT 4062566804 2181596 2172802
YELLOWSTONE HISTORIC CENTER HISTORY MUSEUM & PRESERVATION 8403000264 W YELLOWSTONE MT 4066467461 255815 230217
COLBURN GEM AND MINERAL MUSEM HISTORY MUSEUM & PRESERVATION 8403700515 ASHVILLE NC 8282547162 330164 317644
NATIONAL MUSEUM OF ROLLER SKATING HISTORY MUSEUM & PRESERVATION 8403100219 LINCOLN NE 4024837551 177346 126540
SHATTUCK OBSERVATORY SCIENCE & TECHNOLOGY MUSEUM OR PLANETARIUM 8409500899 HANOVER NH 6036463411 5506031924 1193865978
ADIRONDACK ARCHITECTURAL HERITAGE HISTORY MUSEUM & PRESERVATION 8403601882 KEESEVILLE NY 5188349328 346770 337309
METROPOLITAN MUSEUM OF ART ART MUSEUM 8403600743 NEW YORK NY 2125357720 1451845308 660935260
LAKE ERIE ISLANDS NATURE AND WILDLIFE CENTER ARBORETUM, BOTANICAL GARDEN, OR NATURE CENTER 8403901033 PUT IN BAY OH 4192852804 148268 125858
REINBERGER GALLERIES ART MUSEUM 8409503930 CLEVELAND OH 2164217000 35510552 30853473
WASHINGTON CROSSING HISTORIC PARK HISTORY MUSEUM & PRESERVATION 8404200012 WASHINGTON CROSSING PA 2154934076 469064 381110
ABBEVILLE COUNTY HISTORICAL SOCIETY HISTORY MUSEUM & PRESERVATION 8404500372 ABBEVILLE SC 8643668193 52833 27448
COCKRELL BUTTERFLY CENTER HISTORY MUSEUM & PRESERVATION 8404800332 HOUSTON TX 7136394629 48352770 33233793
CAPITOL REEF NATURAL HISTORY ASSOCIATION ARBORETUM, BOTANICAL GARDEN, OR NATURE CENTER 8404900248 TORREY UT 4354254106 835651 384024
WRIGHT EDUCATIONAL & CULTURAL CENTER HISTORY MUSEUM & PRESERVATION 8405100385 SPOTSYLVANIA VA 5405827583 30606 30606
PALOUSE DISCOVERY SCIENCE CENTER SCIENCE & TECHNOLOGY MUSEUM OR PLANETARIUM 8405300343 PULLMAN WA 5093326869 198299 196226
CABLE NATURAL HISTORY MUSEUM HISTORY MUSEUM & PRESERVATION 8405500767 CABLE WI 7157983890 536425 522900

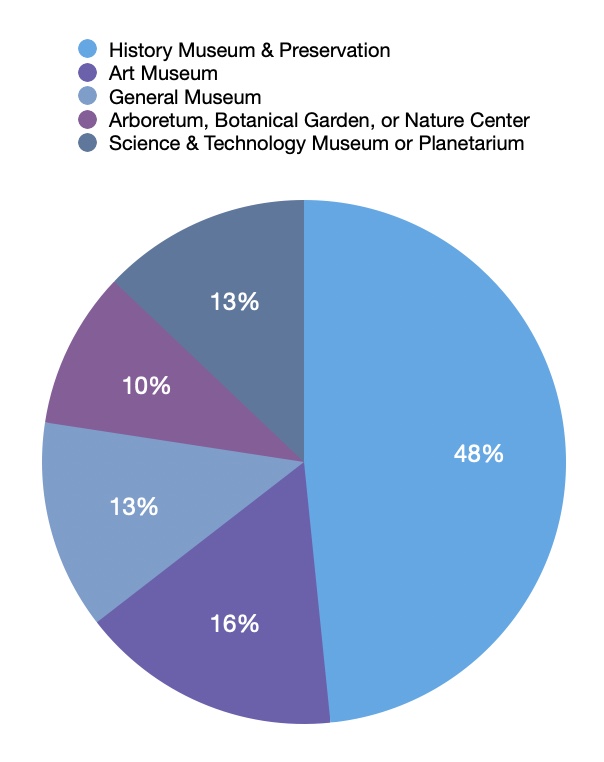
This pie chart shows the ratio of types of Museums. While the dataset is only a portion, it can be representative of all museums in the US. According to the pie chart, history museums make up almost half of all the museums at 48%. This aligns with a statistic from the Institutue of Musuem & Library Services "The largest categories are historical societies and unclassified and general museums with 48 percent and 33 percent respectively." (https://www.imls.gov/news/government-doubles-official-estimate-there-are-35000-active-museums-us). Some reasoning for this could be that many of our history museums cover niche topics or global history, reflecting the country's diverse population and its connections to world events.

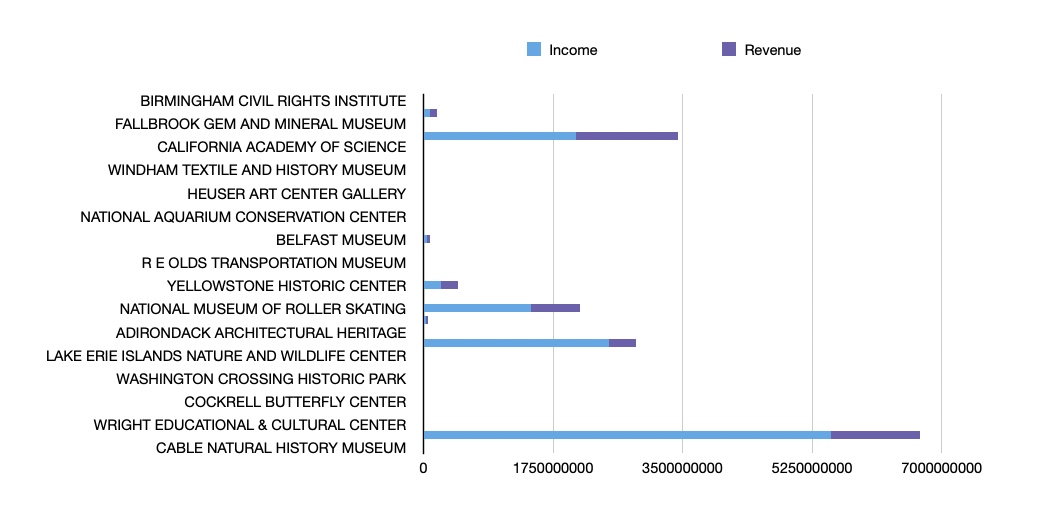
This stacked bar chart compares the income and revenue of museums across the US. While some museums show significantly higher revenue and income (potential outlier), others have relatively balanced and modest financials where revenue and income are close in value. The disparity between income and revenue could be attributed to factors such as funding sources, operational costs, visitor numbers, or the museum's scale and popularity.

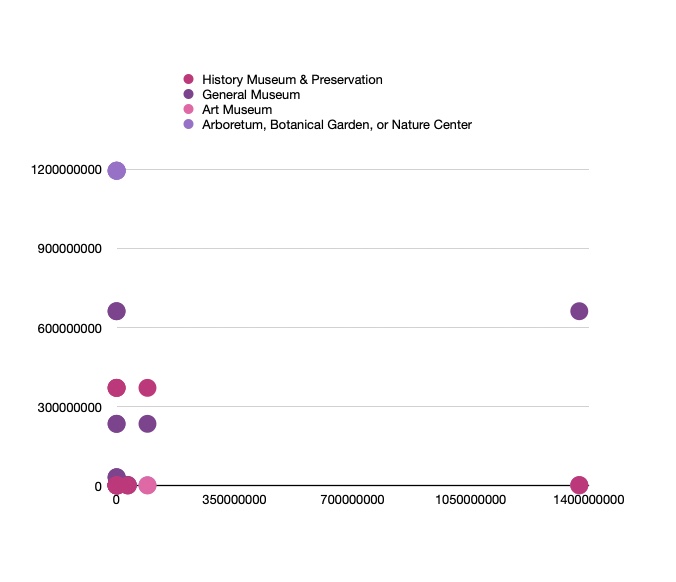
This scatter plot depicts income and revenue for museums in the US, classified by type. The data shows that general museums as well as arboretums, botanical gardens, or nature centers earn far more revenue than other types of museums, some with revenue exceeding one billion dollars. The combination of history museums and art museums appears on the lower end of revenue and income, implying that these types of institutions function on comparatively modest budgets and/or tend to be more dependent on funding from other sources. Considering history museums are the most common museums, this was an interesting find.